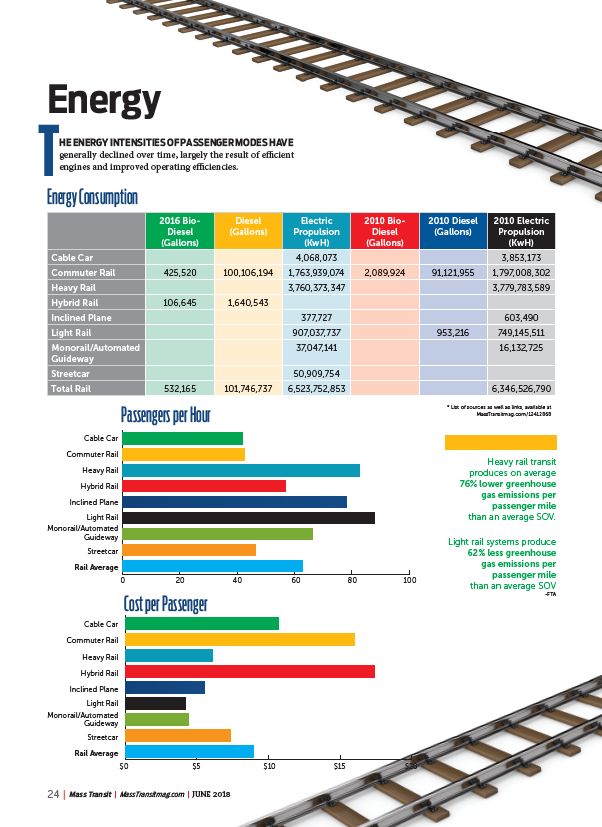
HE ENERGY INTENSITIES OF PASSENGER MODES HAVE
generally declined over time, largely the result of effi cient
engines and improved operating effi ciencies.
Energy Consumption
2016 Bio-
Diesel
(Gallons)
Cost per Passenger
Cable Car
Commuter Rail
Heavy Rail
Hybrid Rail
Inclined Plane
Light Rail
Monorail/Automated
Guideway
Streetcar
Rail Average
Diesel
(Gallons)
Electric
Propulsion
(KwH)
2010 Bio-
Diesel
(Gallons)
$0 $5 $10 $15 $20
2010 Diesel
(Gallons)
2010 Electric
Propulsion
(KwH)
Cable Car 4,068,073 3,853,173
Commuter Rail 425,520 100,106,194 1,763,939,074 2,089,924 91,121,955 1,797,008,302
Heavy Rail 3,760,373,347 3,779,783,589
Hybrid Rail 106,645 1,640,543
Inclined Plane 377,727 603,490
Light Rail 907,037,737 953,216 749,145,511
Monorail/Automated
37,047,141 16,132,725
Guideway
Streetcar 50,909,754
Total Rail 532,165 101,746,737 6,523,752,853 6,346,526,790
Passengers per Hour
Cable Car
Commuter Rail
Heavy Rail
Hybrid Rail
Inclined Plane
Light Rail
Monorail/Automated
Guideway
Streetcar
Rail Average
0 20 40 60 80 100
* List of sources as well as links, available at
MassTransitmag.com/12412868
Energy
T
Heavy rail transit
produces on average
76% lower greenhouse
gas emissions per
passenger mile
than an average SOV.
Light rail systems produce
62% less greenhouse
gas emissions per
passenger mile
than an average SOV
-FTA
24 | Mass Transit | MassTransitmag.com | JUNE 2018
/12412868
/MassTransitmag.com