FOCUS ON DEMOGRAPHICS AND PURCHASING AUTHORITY
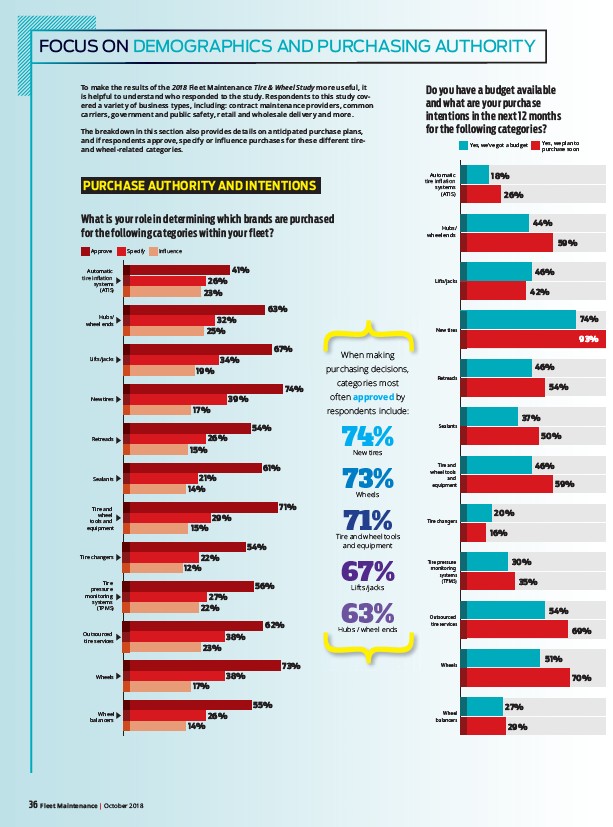
What is your role in determining which brands are purchased
for the following categories within your fleet?
Do you have a budget available
and what are your purchase
intentions in the next 12 months
for the following categories?
To make the results of the 2018 Fleet Maintenance Tire & Wheel Study more useful, it
is helpful to understand who responded to the study. Respondents to this study covered
a variety of business types, including: contract maintenance providers, common
carriers, government and public safety, retail and wholesale delivery and more.
The breakdown in this section also provides details on anticipated purchase plans,
and if respondents approve, specify or influence purchases for these different tire-
and wheel-related categories.
Approve Specify ΖQȵXHQFH
Automatic
WLUHLQȵDWLRQ
systems
(ATIS)
Hubs/
wheel ends
Lifts/jacks
New tires
Retreads
Sealants
Tire and
wheel
tools and
equipment
Tire changers
Tire
pressure
monitoring
systems
(TPMS)
Outsourced
tire services
Wheels
Wheel
balancers
41%
26%
23%
63%
32%
25%
67%
19%
34%
54%
15%
26%
61%
21%
14%
71%
15%
29%
54%
22%
12%
56%
27%
22%
62%
23%
38%
73%
17%
38%
55%
14%
26%
74%
39%
17%
Automatic
WLUHLQȵDWLRQ
systems
(ATIS)
Hubs/
wheel ends
Lifts/jacks
New tires
Retreads
Sealants
Tire and
wheel tools
and
equipment
Tire changers
Tire pressure
monitoring
systems
(TPMS)
Outsourced
tire services
Wheels
Wheel
balancers
Yes, we’ve got a budget Yes, we plan to
18%
26%
44%
59%
46%
42%
74%
93%
46%
54%
37%
50%
46%
59%
20%
16%
30%
35%
54%
69%
51%
70%
27%
29%
purchase soon
When When making
purchasing decisions,
categories most
often approved by
respondents include:
74% New tires
73% Wheels
71% Tire and wheel tools
and equipment
67% Lifts/jacks
63% Hubs Hubs / wheel wheel ends
PURCHASE AUTHORITY AND INTENTIONS
36 Fleet Maintenance | October 2018